


By J.R. Dunn, American Thinker
Through its influence in the media and government (both bureaucracy and congress), the Greens effectively abolished nuclear power, curtailed domestic oil production, and left the American energy industry in the comatose state in which it abides to this day. Nor this was an error or overreaction - it was a deliberate effort to fulfill the Green agenda.What is the nature of this agenda? Greens were much more open about it during the early years of the movement. (As for example in the utopian novel Ecotopia.)
The end point of all Green efforts is a kind of Edenic state in which humans exist in “partnership” with nature. In which humanity is simply another species. In which the human “footprint” (a purely Green concept with no literal meaning) is reduced to a minimum. A world which has returned in large part to a pre-industrial state, where whatever small amounts of power are needed are provided by solar and wind. Where every last damn item is recycled. A kind of universal Northern California, where all living things from spirochete to grizzly exist in harmony under the cloak of Gaia.
Current energy policy—or non-policy, however you wish—lies at the very center of the Green agenda. It is the only element in which any progress has been achieved. First, we need to rid ourselves of our “addiction” to nukes and oil. Then we adapt to solar and wind, and.... Here it peters off into silence. Because no such second step has ever, or will ever be made. Solar, wind, alcohol, ethanol… all these are single-digit energy sources. (And the low single digits as well, able to replace perhaps two or three percent of power generation at best.) Replacement of oil and nuclear power is a fantasy. Therefore, the rest of the Green dream is as well. But the gutting of the American energy sector remains the Green’s chief accomplishment, their single achieved step toward paradise. Read more here.
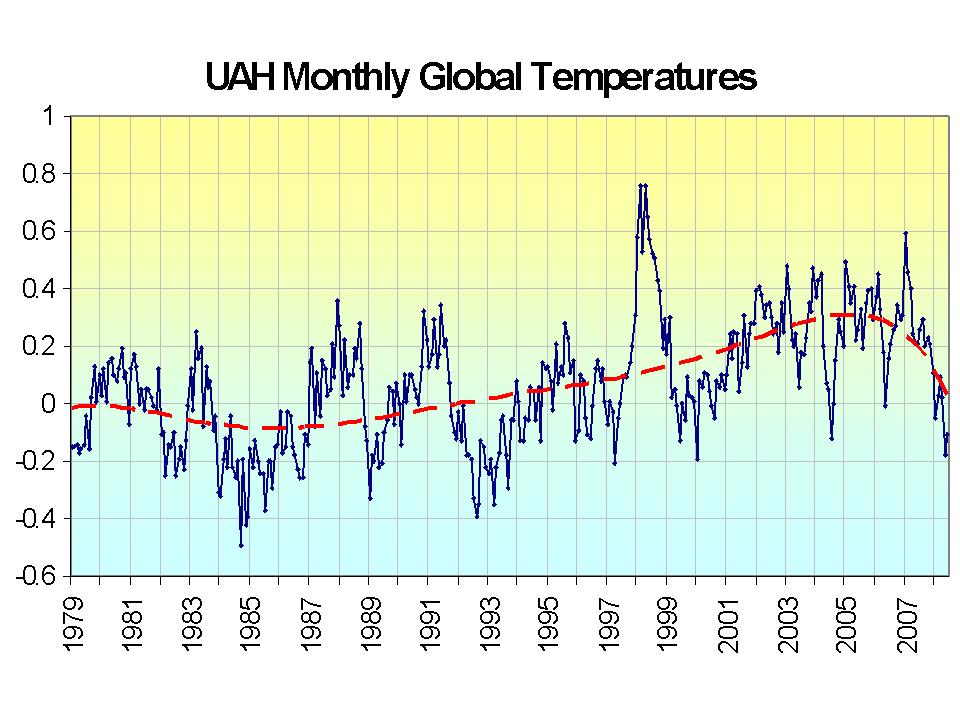
By Dr. John Christy and Dr. Roy Spencer, UAH
June temperatures (preliminary):
Global composite temp.: -0.11 C (about 0.32 degrees Fahrenheit) below the 20-year average for June.
Northern Hemisphere: 0.00 C (about 0.00 degrees Fahrenheit) above 20-year average for June.
Southern Hemisphere: -0.23 C (about 0.56 degrees Fahrenheit) below 20-year average for June.
May temperatures (revised):
Global Composite: -0.18 C below 20-year average
Northern Hemisphere: -0.05 C below 20-year average
Southern Hemisphere: -0.31 C below 20-year average
All temperature variations are based on a 20-year average (1979-1998) for the month reported. Global trend since Nov. 16, 1978: +0.13 C per decade.
Notes on data released July 7, 2008: A La Nina Pacific Ocean cooling event continues to drive tropical and global temperatures: Globally, June 2008 was the coolest June since 1999, according to Dr. John Christy, diector of the Earth System Science Center at The University of Alabama in Huntsville. While the La Nina is a tropical event, cool temperatures covered a large portion of the globe. Among the past 30 Junes, June 2008 was the third coldest south of the Antarctic Circle, fourth coolest in the Southern Hemisphere and fifth coolest in the tropics. The Antarctic continent saw its third coldest June in 30 years, with temperatures averaging -1.53 C cooler than the seasonal norm. Portions of Anarctica south of Australia were as much as 5.5 C (9.9 degrees Fahrenheit) colder than seasonal norms for the first month of winter. While La Nina has caused global average temperatures to fall by more than 0.7 C (about 1.26 degrees F) since January 2007, June was only the eleventh cooler than normal month since January 1999.

See full size image here.
Color maps of local temperature anomalies may soon be available on-line at: http://climate.uah.edu/. The processed temperature data is available on-line here .
As part of an ongoing joint project between UAH, NOAA and NASA, Christy and Dr. Roy Spencer, a principal research scientist in the ESSC, use data gathered by microwave sounding units on NOAA and NASA satellites to get accurate temperature readings for almost all regions of the Earth. This includes remote desert, ocean and rain forest areas for which reliable climate data are not otherwise available. The satellite-based instruments measure the temperature of the atmosphere from the surface up to an altitude of about eight kilometers above sea level. Once the monthly temperature data is collected and processed, it is placed in a “public” computer file for immediate access by atmospheric scientists in the U.S. and abroad. Neither Spencer nor Christy receives any research support or funding from oil, coal or industrial companies or organizations, or from any private or special interest groups. All of their climate research funding comes from state and federal grants or contracts.
By Roger Pielke Sr., Climate Science
The Rueters news article by Deborah Zabarenko, Environment Correspondent on July 1 2008 is titled “Midwest floods show signs of global warming”. This article is an excellent example of the bias that exists in the communication of climate information to the public.
Excerpts from the article illustrate this bias; “Floods like those that inundated the U.S. Midwest are supposed to occur once every 500 years but this is the second since 1993, suggesting flawed forecasts that do not take global warming into account, conservation experts said on Tuesday. ‘Although no single weather event can be attributed to global warming, it’s critical to understand that a warming climate is supplying the very conditions that fuel these kinds of weather events,“‘said Amanda Staudt, a climate scientist with the National Wildlife Federation. “Warmer air can carry more water, Staudt said in a telephone briefing, and this means more heavy precipitation in the central United States. Big Midwestern storms that used to be seen every 20 years or so will likely occur every four to six years by century’s end, she said.”
This is, unfortunately, not a news article with a scientific basis. Dr. Staudt presents no evidence that this flood event is due to warmer air and an increase in atmospheric water vapor. Water vapor, for example, has been shown to not have increased over North America.
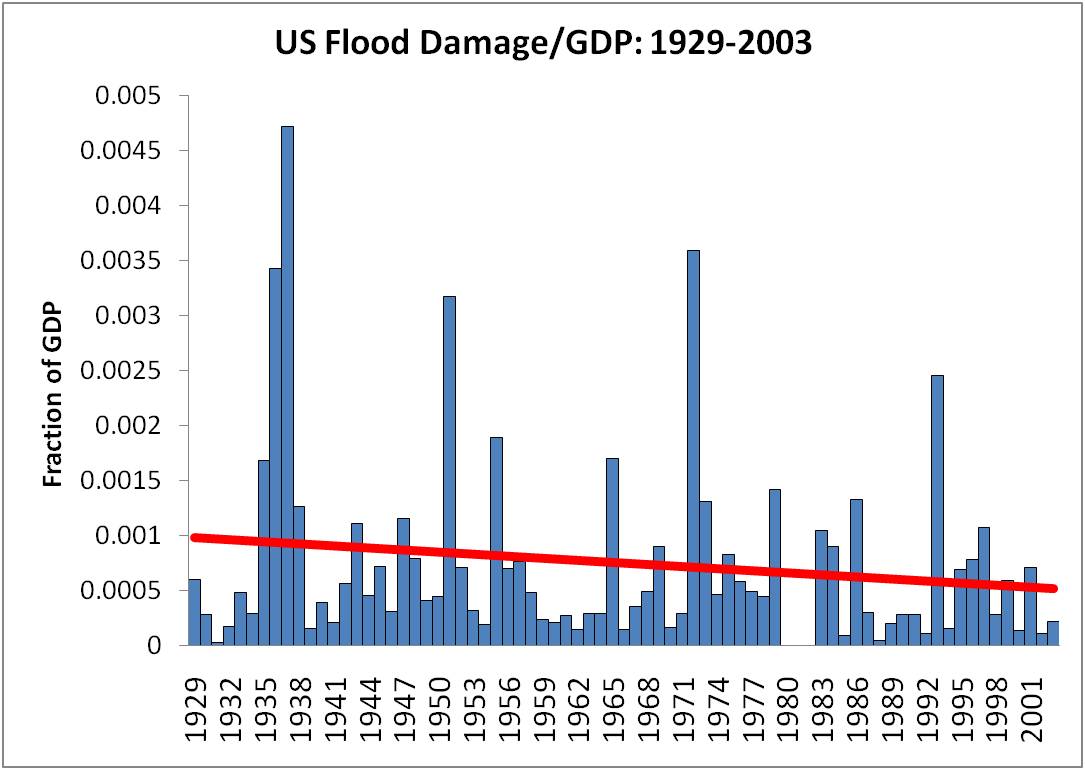
She also ignored evidence that flood losses are actually decreasing in the United States; i.e. see U.S. Flood Damage 1929-2003 [posted June 16 2008 on Prometheus].
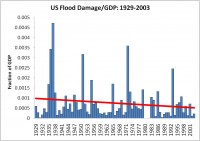
See larger image here
Moreover, she fails to present peer reviewed papers that document an observed change in the weather events that caused this flooding. Indeed, the reason for the flooding was the unusually persistent cool air west of the flood region which provide a strong frontal boundary between the air of polar origin and the humid tropical air to the east. The attribution of the floods to global warming, rather than the actual cause of the flood due to a persistent frontal boundary, exemplifies the misuse of science to promote a particular perspective on climate science. Both Dr. Staudt and the reporter, Ms. Deborah Zabarenko, have misrepresented this issue.
Read full post here.
By Bob Halstead on Jennifer Marohasy Blog
Dear Jennifer,
The shallows near Dobu Island off Papua and New Guinea have active underwater fumaroles pumping out virtually pure CO2. The sea grass is extraordinarily lush and healthy and there is very healthy coral reef a few metres away.

Both photos show bubbles of CO2 which continually flow. I collected samples of gas years ago for a vulcanologist and he reported back to me that it was “virtually pure CO2”. Unfortunately the water had poor visibility the day I shot the pictures, but it is often clear.
Bob Halstead
Also sea Floor Anthoni’s excellent site we have listed before here.
By Joseph D’Aleo, Fellow of the AMS, CCM
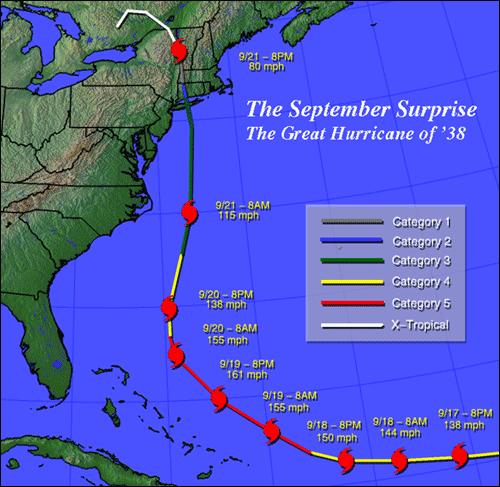
Hurricane season is underway. La Nina years, we have said are usually memorable for winter snows and cold, spring floods and tornadoes, late winter and spring forest fires in Florida, summer heat and drought in onset years (last summer in the eastern Corn Belt and southeast) and eventually active hurricane seasons with enhanced landfall potential along the east coast and western Gulf of Mexico. All but the last has verified so far but the peak of the hurricane season is ahead of us. Given the way irresponsible media and environmental groups like the NWF have been blaming the floods and tornadoes on global warming (even though the globe has cooled for 7years and that these events are associated with unusual cool weather patterns not warming as we clearly saw this spring), expect them to blame any landfall on climate change and greenhouse gases. They are shameless in their lying to try and save their cause thinking the public is gullible to their exaggerations. In this feature published this week on Intellicast, I tell the story of the Great Hurricane of ‘38 which came as a complete surprise and devastated Long Island and New England. That was a La Nina year not unlike this year with a warm Atlantic.
The year is 1938. Another hot Dust Bowl summer is drawing to a close. The heat has not been as extreme this summer as in some of the prior summers this decade, but it still has been hot, by most all accounts, too hot. The hurricane season is well underway. This one has been uneventful, so far. On Saturday, September 10, a strong tropical wave moves quietly off the coast of Africa and out into the Atlantic where it soon becomes a tropical storm. It is a Cape Verde-type storm, typical of that time of year, in a La Nina summer, long before we knew what that meant. For the next 6 days, it spirals slowly westward and intensifies. On Friday, September 16, the Brazilian vessel S.S. Alegrete reports that the storm, now a hurricane, is currently located off the Leeward Islands in the Atlantic and is still moving to the west. On Sunday, September 18, the storm is situated due north of Puerto Rico and due east of the Bahamas. It is travelling west now at a goodly speed - 15 to 20 mph, on a track towards southern Florida. Gordon Dunn and Grady Norton, U.S. Weather Bureau forecasters in Florida, issue a hurricane warning for Miami for expected landfall on Tuesday, September 20. Miami residents react quickly - stockpiling supplies, boarding windows and securing their boats. Floridians took talk of hurricanes seriously. Just three years before in 1935, the strongest hurricane ever to hit the United States inundated the Florida Keys with winds of 200 mph. Miami residents no doubt had read of the many terrifying stories of that storm. One horrific tale told of people caught outside who were sandblasted to death - all that was left were shiny belt buckles and shoes. This 1938 storm, though not quite as strong as the 1935 storm, has now become a category 5 hurricane (the most powerful category on the Saffir-Simpson Scale of hurricane intensity).
On Monday, September 19, the storm takes a sudden turn to the north as so many Cape Verde storms do. Meteorologists know this as recurvature. Forecasters breathe a collective sigh of relief. Every prior storm since 1900 that took this turn in this location continued on a big graceful curve that brought it harmlessly out to sea. Forecasters thought that this storm surely would do the same - the prevailing westerly winds to the north would see to it. New York City and New England barely take notice. New York had not felt the power of a major hurricane since 1821. Not since 1815 had a storm of this intensity struck New England. Most people have never even heard of the word hurricane or are totally unaware that they can affect non-tropical climes. The storm moves out of range of observing stations after it passes the Bahamas. It would be more than 20 years until we had “eyes-in-the-sky” - weather satellites to monitor storms in the open sea. This “stealth” storm is out there, but forecasters can only guess where it is now and where it is going. Read what happens next here.
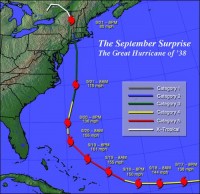
See full size track map here.
Dr. Roy Spencer, University of Alabama, Huntsville
The following is an abstract from a simplified version of a paper entitled “Chaotic Radiative Forcing, Feedback Stripes, and the Overestimation of Climate Sensitivity” I submitted on June 25, 2008 for publication in the Bulletin of the American Meteorological Society that can be seen here.
Previous satellite estimates of how efficiently the Earth radiatively cools to outer space have suggested that the climate system is quite sensitive to small perturbations. The perturbation of most concern is the warming tendency from humans adding carbon dioxide to the atmosphere through fossil fuel burning, since a very sensitive climate system could magnify that warming by a very large amount.
Here it is shown, with both observations and a simple model, that those estimates of climate sensitivity were based upon a faulty assumption regarding clouds. Specifically, it has been assumed (explicitly or implicitly) that, in the global average on time scales of three months or more, temperature variations cause clouds to change, but that cloud variations do not cause temperature to change. When properly filtered, the satellite data reveal evidence of cloud variations indeed causing temperature changes, and that this source of natural climate variability biases the estimate of climate sensitivity in the direction of a very sensitive climate system.
The new interpretation suggests a very low sensitivity. If the new sensitivity estimate is accurate, it would suggest only 0.5 deg. C of manmade warming by the year 2100. The new sensitivity estimate also suggests that warming over the last century can not be explained by human greenhouse gas emissions alone, but instead might require a mostly natural explanation. Read and see much more here.
By Ralf Roechert, EurekAlert
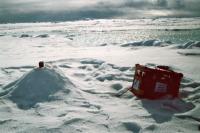
An international team of researchers was able to provide evidence of explosive volcanism in the deeps of the ice-covered Arctic Ocean for the first time. Researchers from an expedition to the Gakkel Ridge, led by the American Woods Hole Oceanographic Institution (WHOI), report in the current issue of the journal Nature that they discovered, with a specially developed camera, extensive layers of volcanic ash on the seafloor, which indicates a gigantic volcanic eruption.
“Explosive volcanic eruptions on land are nothing unusual and pose a great threat for whole areas,” explains Dr Vera Schlindwein of the Alfred Wegener Institute for Polar and Marine Research in the Helmholtz Association. She participated in the expedition as a geophysicist and has been, together with her team, examining the earthquake activity of the Arctic Ocean for many years. “The Vesuvius erupted in 79 AD and buried thriving Pompeii under a layer of ash and pumice. Far away in the Arctic Ocean, at 85N 85E, a similarly violent volcanic eruption happened almost undetected in 1999 - in this case, however, under a water layer of 4,000 m thickness.” So far, researchers have assumed that explosive volcanism cannot happen in water depths exceeding 3 kilometres because of high ambient pressure. “These are the first pyroclastic deposits we’ve ever found in such deep water, at oppressive pressures that inhibit the formation of steam, and many people thought this was not possible,” says Robert Reves-Sohn, staff member of the WHOI and lead scientist of the expedition carried out on the Swedish icebreaker Oden in 2007.
By Richard S Courtney on SPPI
The UK Energy White Paper was published by the UK’s Department of Trade and Industry (DTI) in May 2003. It proposed the objective of a contribution to reduction of carbon dioxide (CO2) emissions by use of ‘renewables’ mostly in the form of windfarms (i.e. local assemblies of wind turbines) to provide 20% of UK electricity supply. However, this paper suggests the use of windfarms cannot make significant contribution to reducing the emissions and suggests the construction of tidal coffer dams instead. Windfarms for power generation provide intermittent power so they merely displace thermal power stations onto standby mode or to operate at reduced efficiency while the thermal power stations wait for the wind to change. They make no significant reduction to pollution because thermal power stations continue to use their fuel and to produce their emissions while operating in standby mode or with reduced efficiency that can increase their emissions at low output. And this need for continuously operating backup means that windfarms can only provide negligible useful electricity to electricity grid supply systems. But the large scale use of windfarms requires upgrading of an electricity grid, more complex grid management, and operation of additional thermal power stations to protect against power cuts in time of supply failure. These effects increase the cost of electricity supplied by the grid in addition to the capital, maintenance and operating costs of the windfarms themselves. And the windfarms cause significant environmental damage.Tidal coffer dams would not have these problems and could provide continuous and controllable power supply at similar cost to off-shore windfarms.
The UK Government is spending much public money to subsidise on-shore and off-shore windfarms in an attempt to contribute to its target of a 20% reduction to CO2 emissions from power generation. This policy is endorsed by the Energy White Paper 2003(1) and the Energy Review 2006(2). However, the intermittent supply from windfarms means they provide no useful electricity and no significant reduction to CO2 emissions. But tidal coffer dams can provide continuous, controllable electricity so they do not suffer from these problems. And OFGEN estimates that tidal coffer dams would produce electricity at similar cost to off-shore windfarms when taking no account of the high return that can be expected for the controllable output from tidal coffer dams. It is concluded that the UK Government should cease the waste of public money that is the subsidising of windfarms and use the saved expenditure to subsidise tidal coffer dams instead. Read more here.
Icecap Note: Agreed. Among one of the first Icecap posts was this one from early 2007: Tidal Power, Clean, Cheap and reliable.